Building Networks#
In this tutorial, it will be shown, how a LigandNetwork can be planned using Konnektor. Please be aware, that the openfe package is required in your python environment. You can easily install it with: pip install openfe.
In the first step, we will create some small molecules, that we want to plan our LigandNetwork with and we will generate an AtomMapper and AtomMappingScorer. The AtomMapper will generate all possible alchemical transformations for the set of molecules, translating to the network edges. Next, the AtomMappingScorer will add the weights to the edges, by expressing on how difficult the transformation will be. This score is between 0, very hard to compute, and 1 for easy to compute:
# Build Small Molecules
from konnektor.data import get_benzene_ligands
compounds = list(filter(lambda x: not x.name in ["lig_2", "lig_3", "lig_4", "lig_7"],
                        get_benzene_ligands()))

# Build Atom Mapper and AtomMappingScorer
from openfe.setup import KartografAtomMapper, lomap_scorers
mapper = KartografAtomMapper()
scorer = lomap_scorers.default_lomap_score
After having the components setup, we can go and plan our network! Here we use the CylicNetworkGenerator. But of course you can use any NetworkGenerator from Konnektor in exactly the same way.:
# Plan the Network
from konnektor.network_planners import CyclicNetworkGenerator

networker = CyclicNetworkGenerator(mappers=mapper,
                                   scorer=scorer,
                                   n_processes=1)

network = networker.generate_ligand_network(compounds)
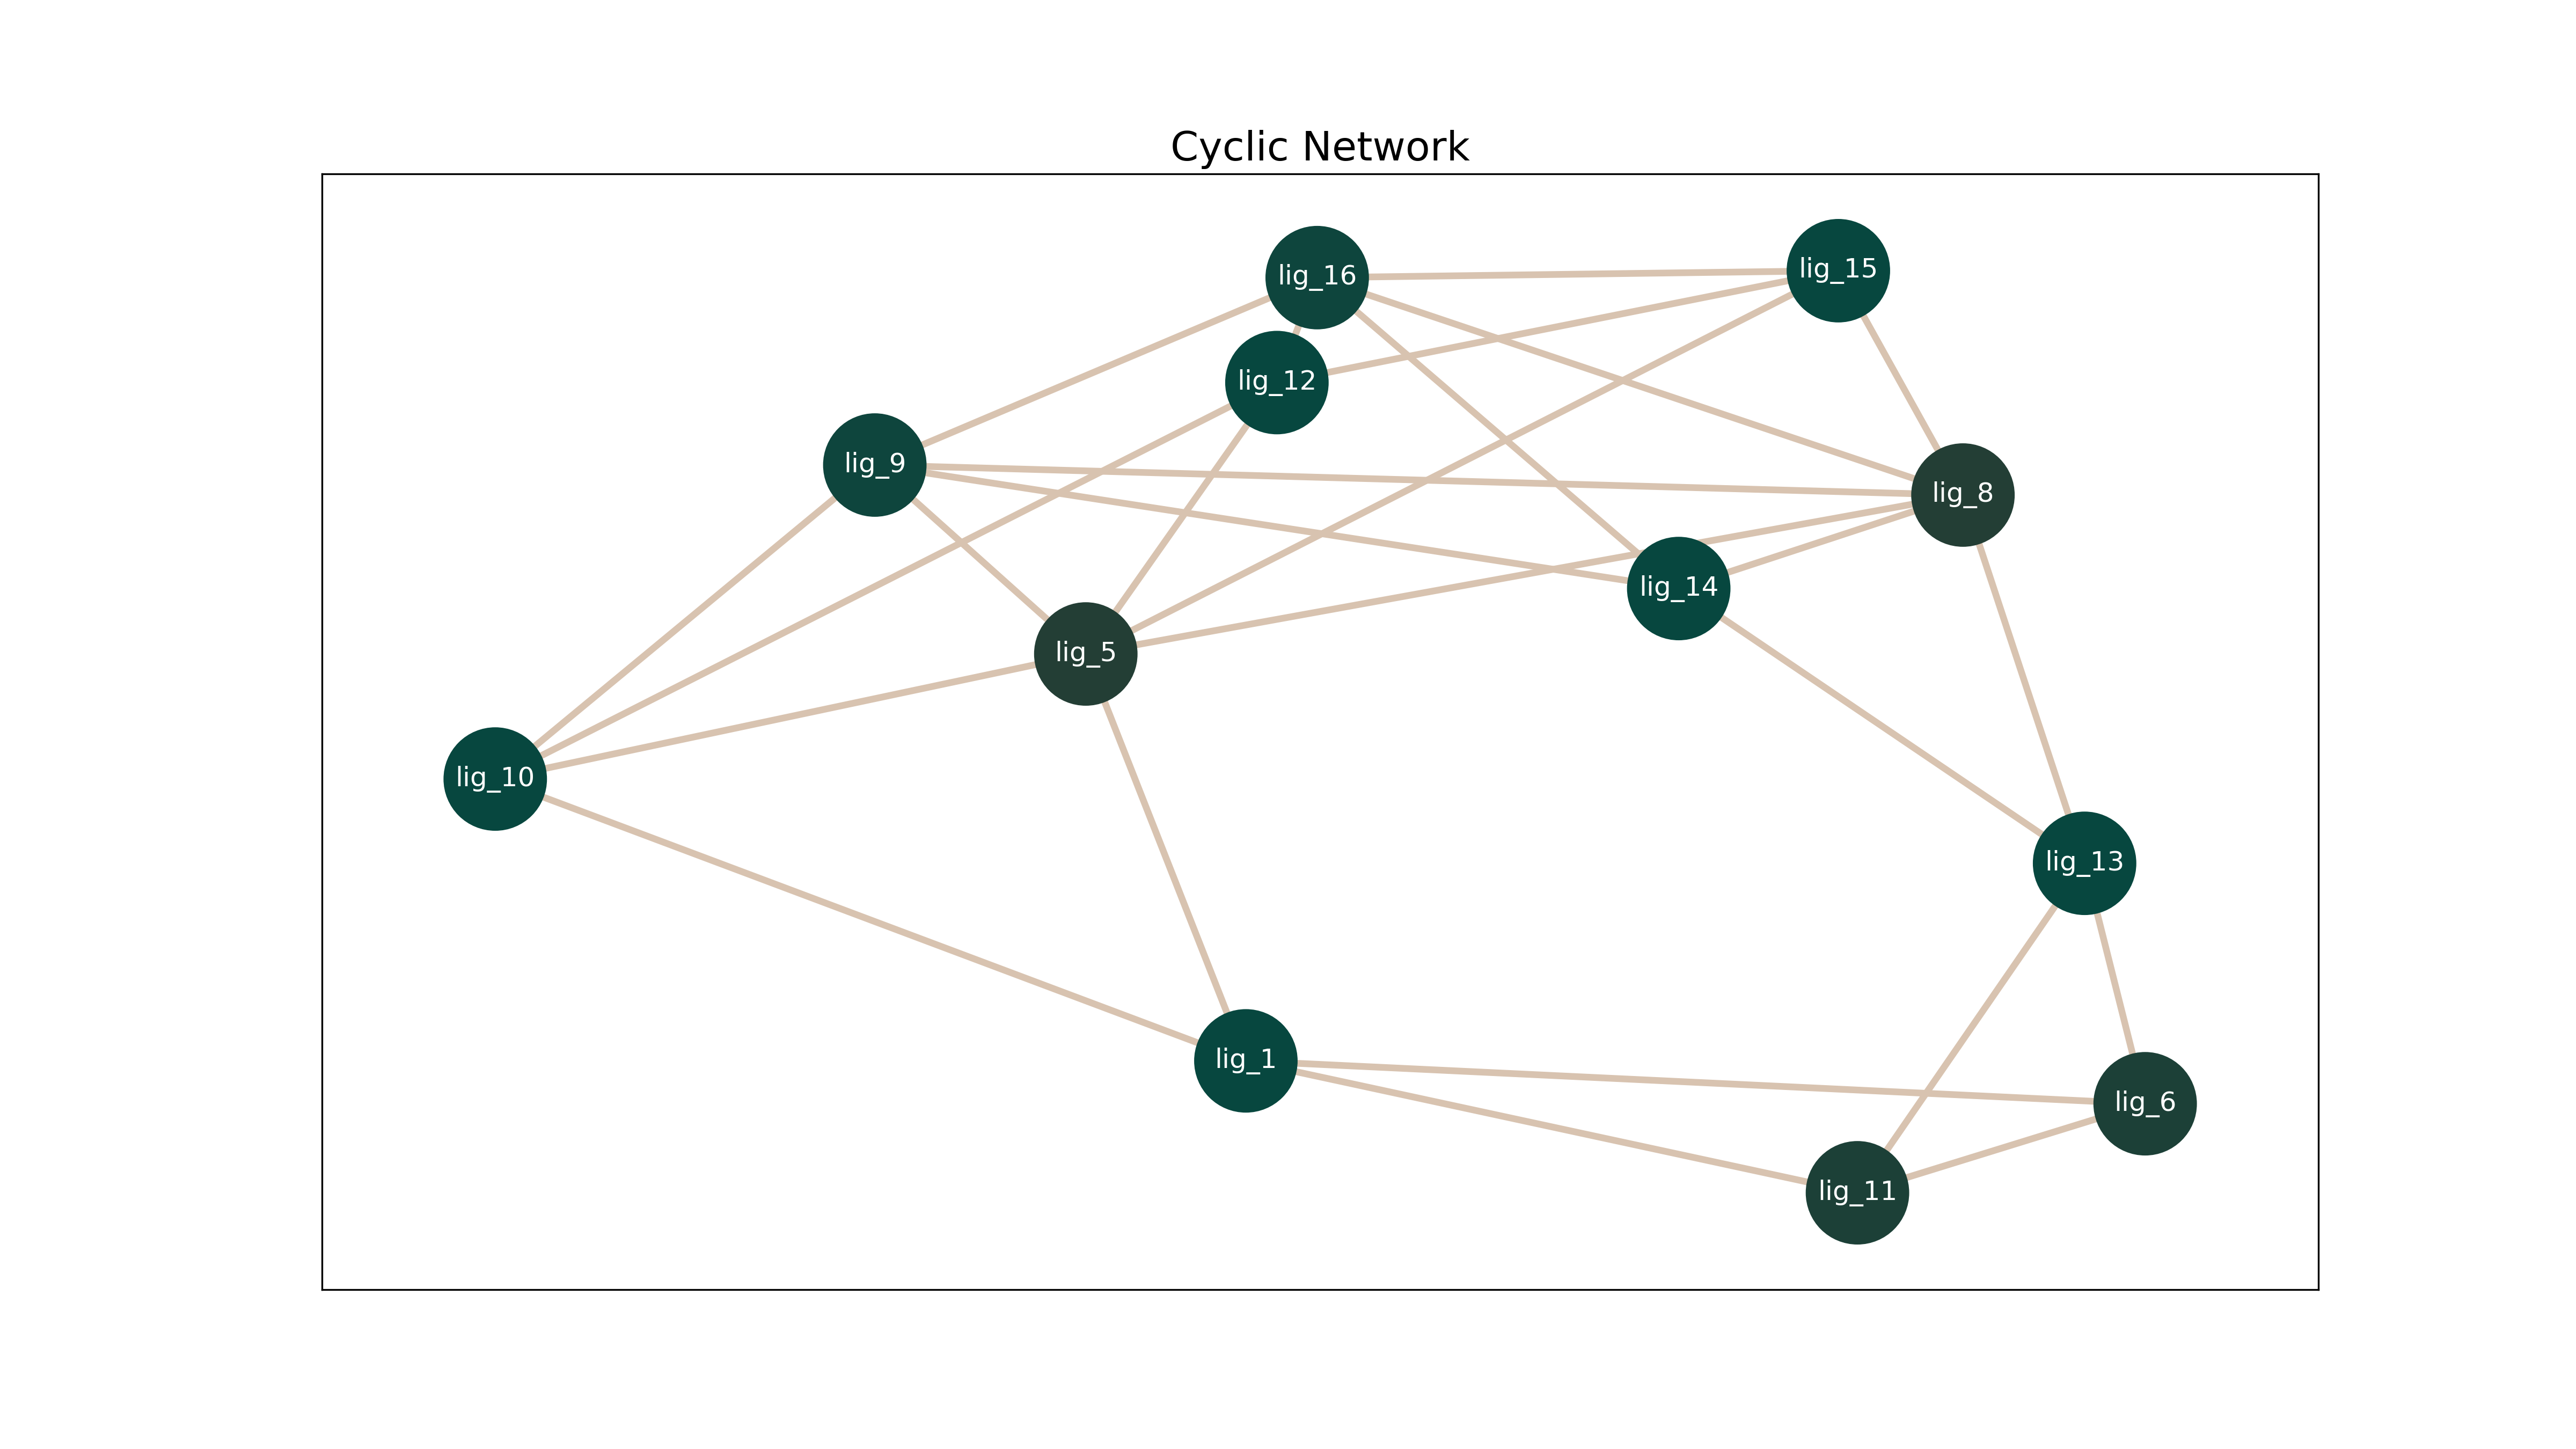
In Order to visualize the Network Konnektor provides you several options. First, you can translate the network into a matplotlib.pyplot.Figure with the function draw_ligand_network.:
# Visualize the generated network
from konnektor.visualization import draw_ligand_network
fig = draw_ligand_network(network=network, title=network.name)

fig.show()
This yields the following visualization:
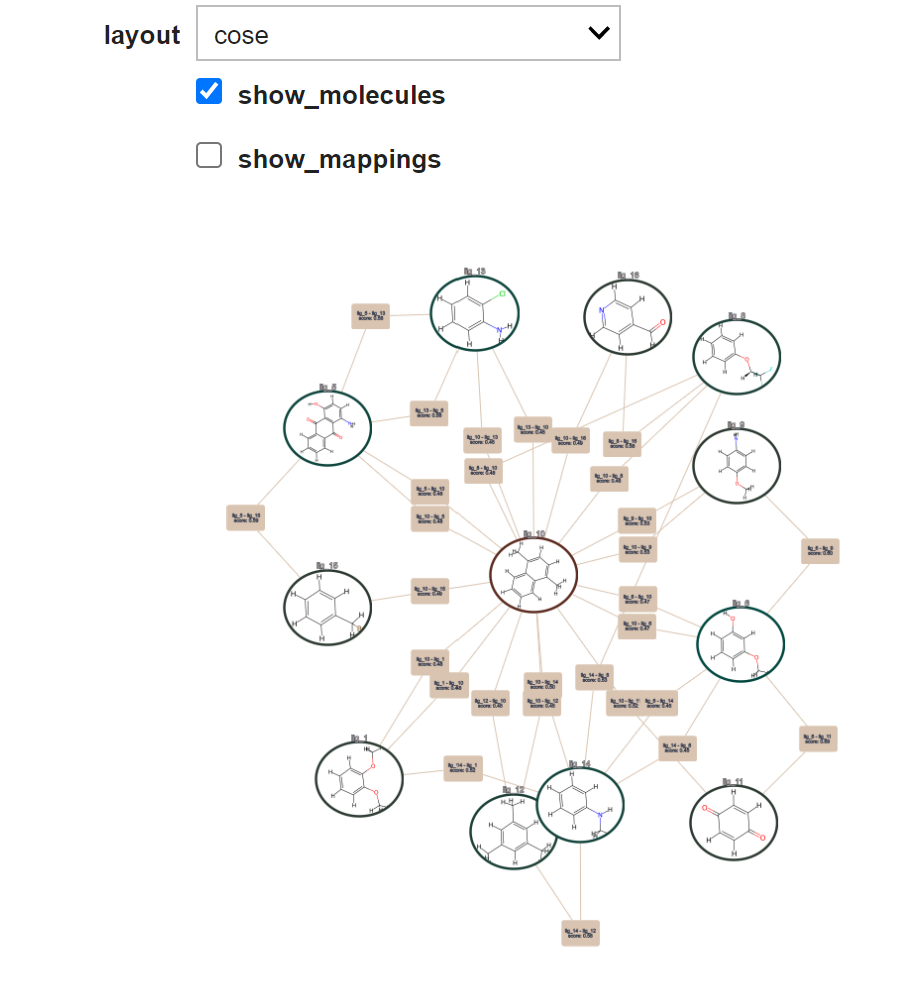
As alternative, Konnektor offers an interactive IPython widget, that allows you interactivley to explore your network.:
# Visualize the generated network in a widget
from konnektor.visualization import draw_network_widget
widget = draw_network_widget(network=network)
widget
This yields the following visualization: